Technology

The Seismostack

One optimized stack, from the geophone in the ground to the alert on your phone. Rugged sensors, a power-optimized gateway and radio link, and detection algorithms trained on real mass movements.

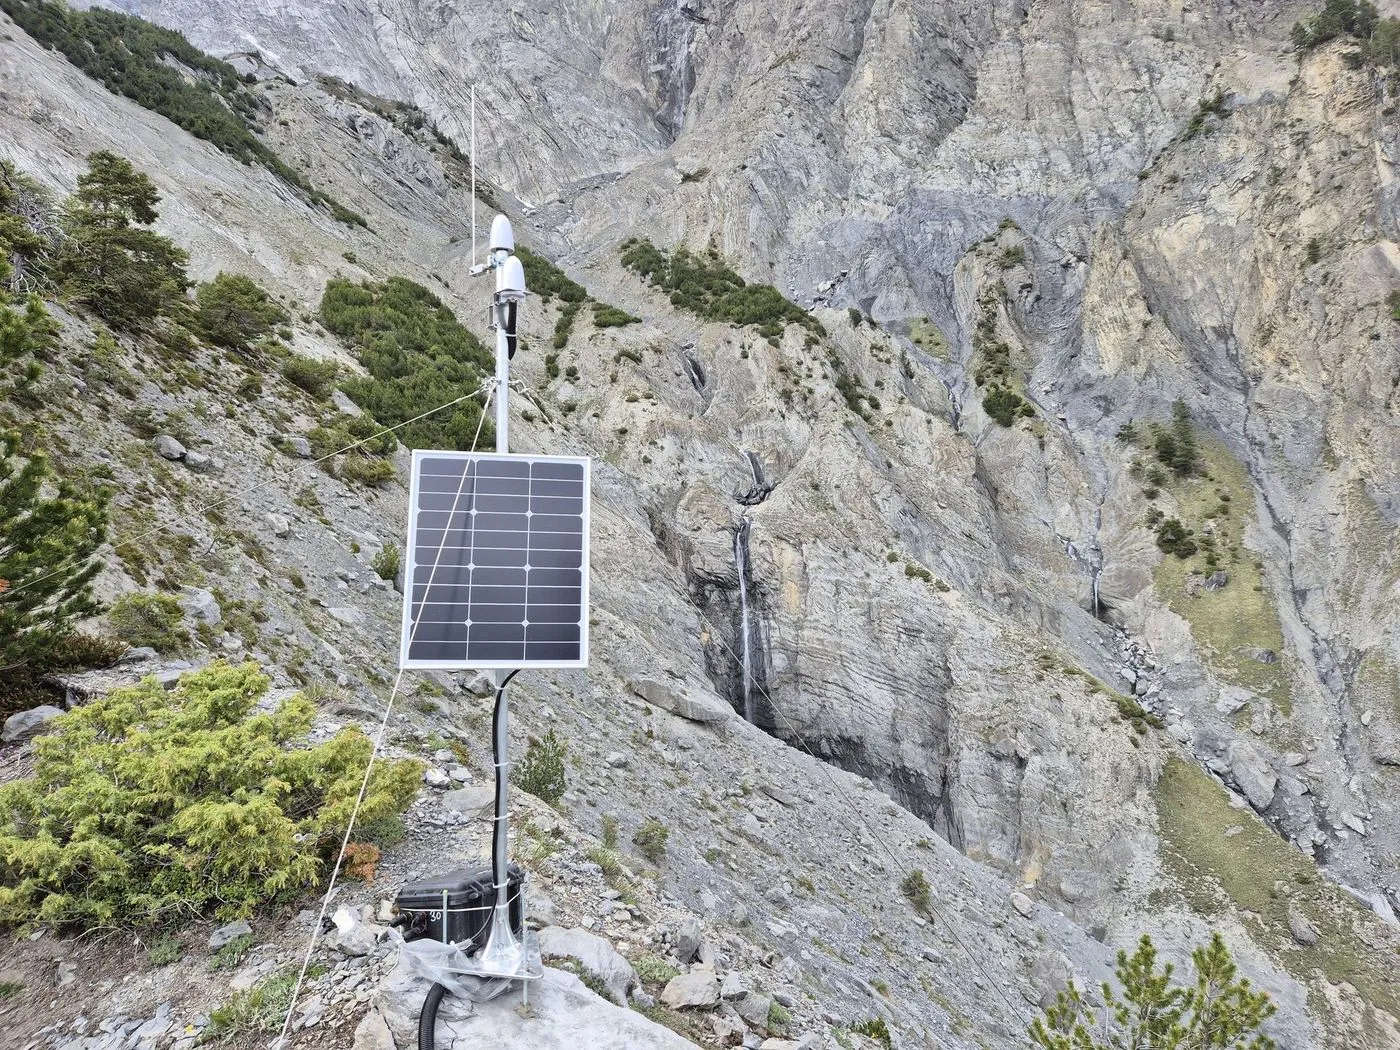
A solar-powered Seismopod installation on a steep flank, overlooking the gully it monitors

The components

Seismopod

Smart seismic sensor for the field

A custom low-power seismic sensor built for terrain that is steep, remote and often snow-covered. It records ground motion continuously and runs the detection algorithm on-device, so a site can be under surveillance without permanent data link.

  • On-device detection — no waveform streaming required
  • Solar or battery powered, with low-power modes for winter operation
  • Rugged device
  • Large sensitivity radius — one pod covers a broad area
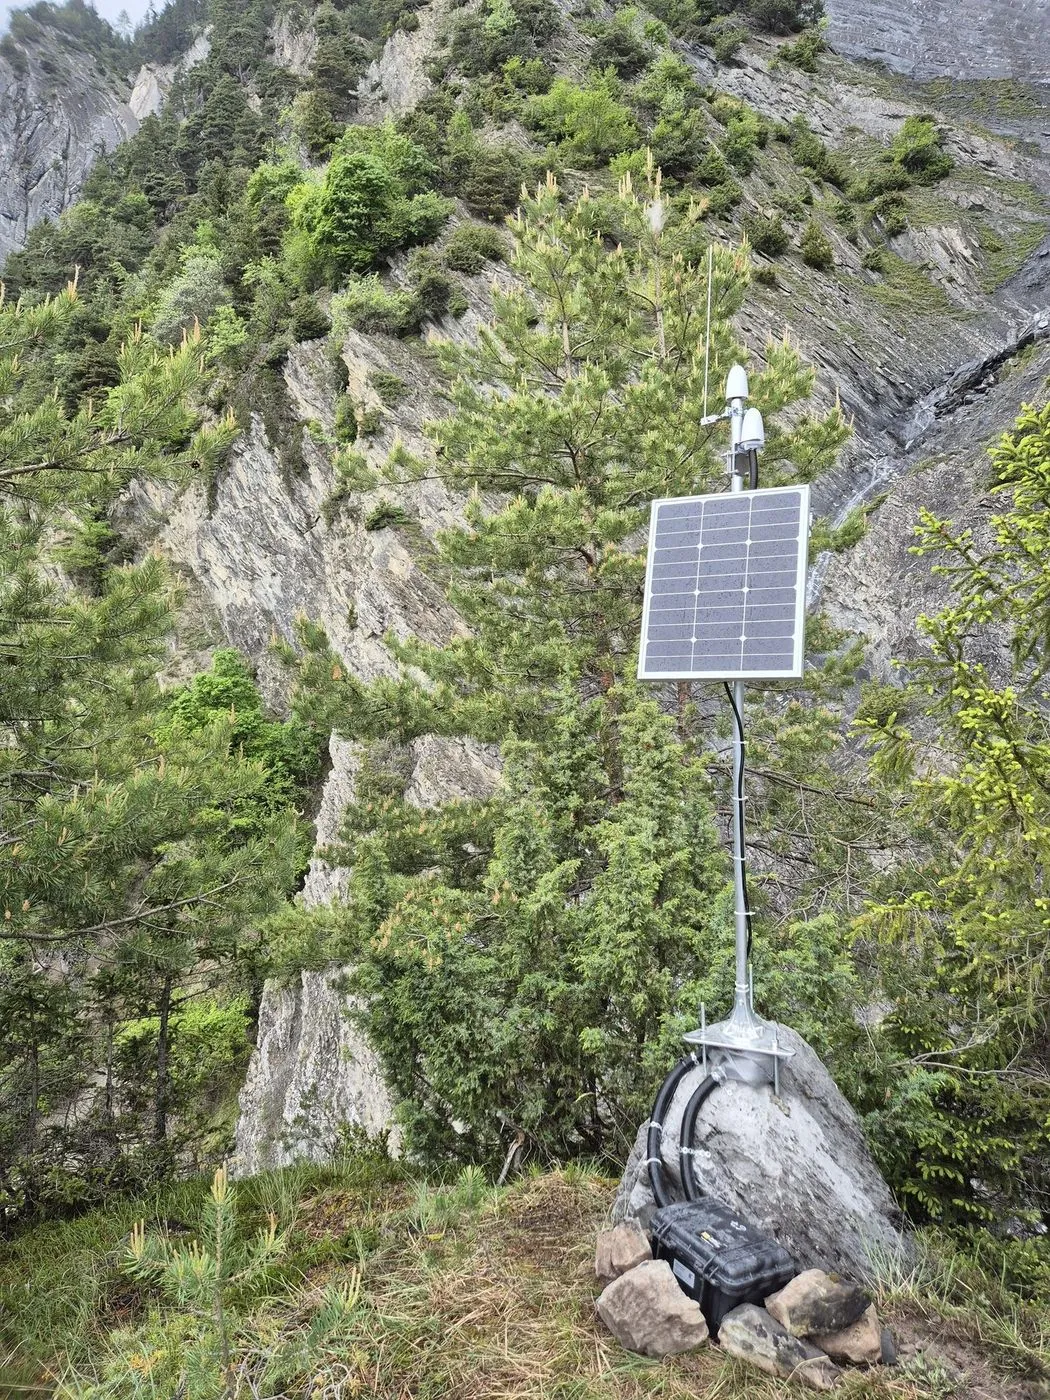
A solar-powered Seismopod station installed in steep rockfall terrain

Seismobase

Self-sufficient on-site gateway

The Seismobase is the decision point of the stack. It gathers the detections reported by every Seismopod, runs a second-stage classifier that combines them across pods, and sends the warning onward. It can run independently of grid power and cell reception, so a regional outage does not take the warning system with it. Where there is cell reception, it forwards warning messages and statistics to our experts and to you.

  • Network-wide coincidence logic before any alert is raised
  • Can operate without grid power or cell reception
  • Fully offline local on-site warning system possible
  • Collects state-of-health from every pod in the network to detect sensor outages
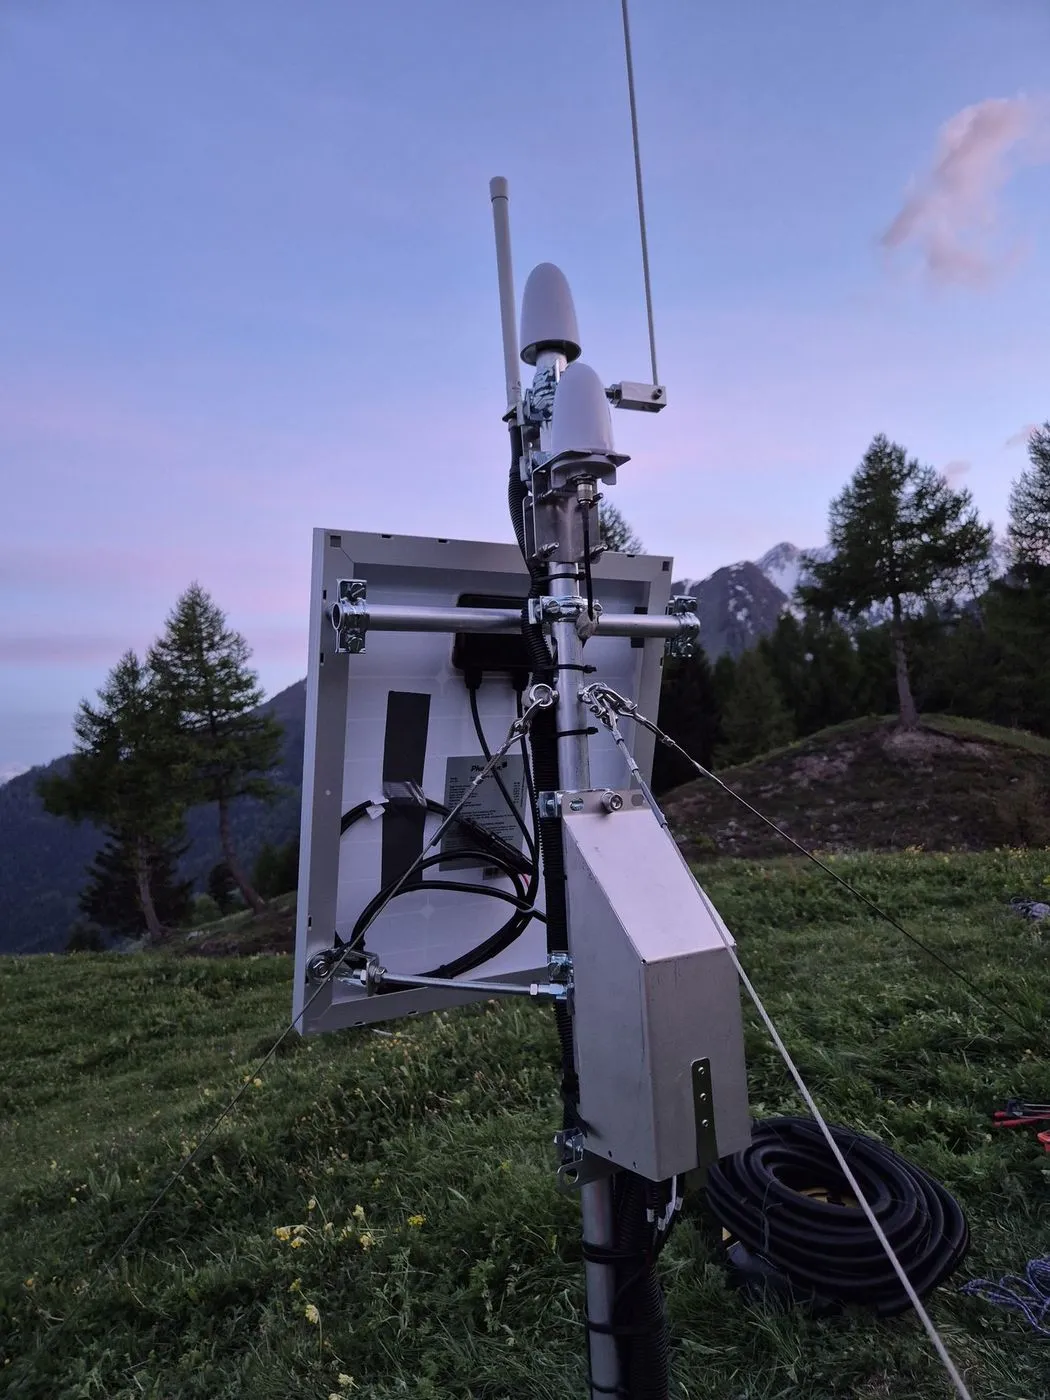
A Seismobase enclosure with GNSS and radio antennas on its mast, at dusk

Wireless connectivity

Built for long distances and small power budgets

Because the pods send findings rather than raw data, the radio link can be optimized for range and power instead of throughput. Our transmission is optimized at every stage to provide robust real-time alerts and energy-efficient long-running statistics. Preprocessed detections travel over LoRa and/or cellular, covering long distances across valleys at a fraction of the energy a streaming link would need.

  • LoRa and/or cellular, chosen per site
  • Fully optimized transmission protocol for real-time transmission and robustness
  • Preprocessed detections instead of raw waveforms
  • Long range at low transmit power
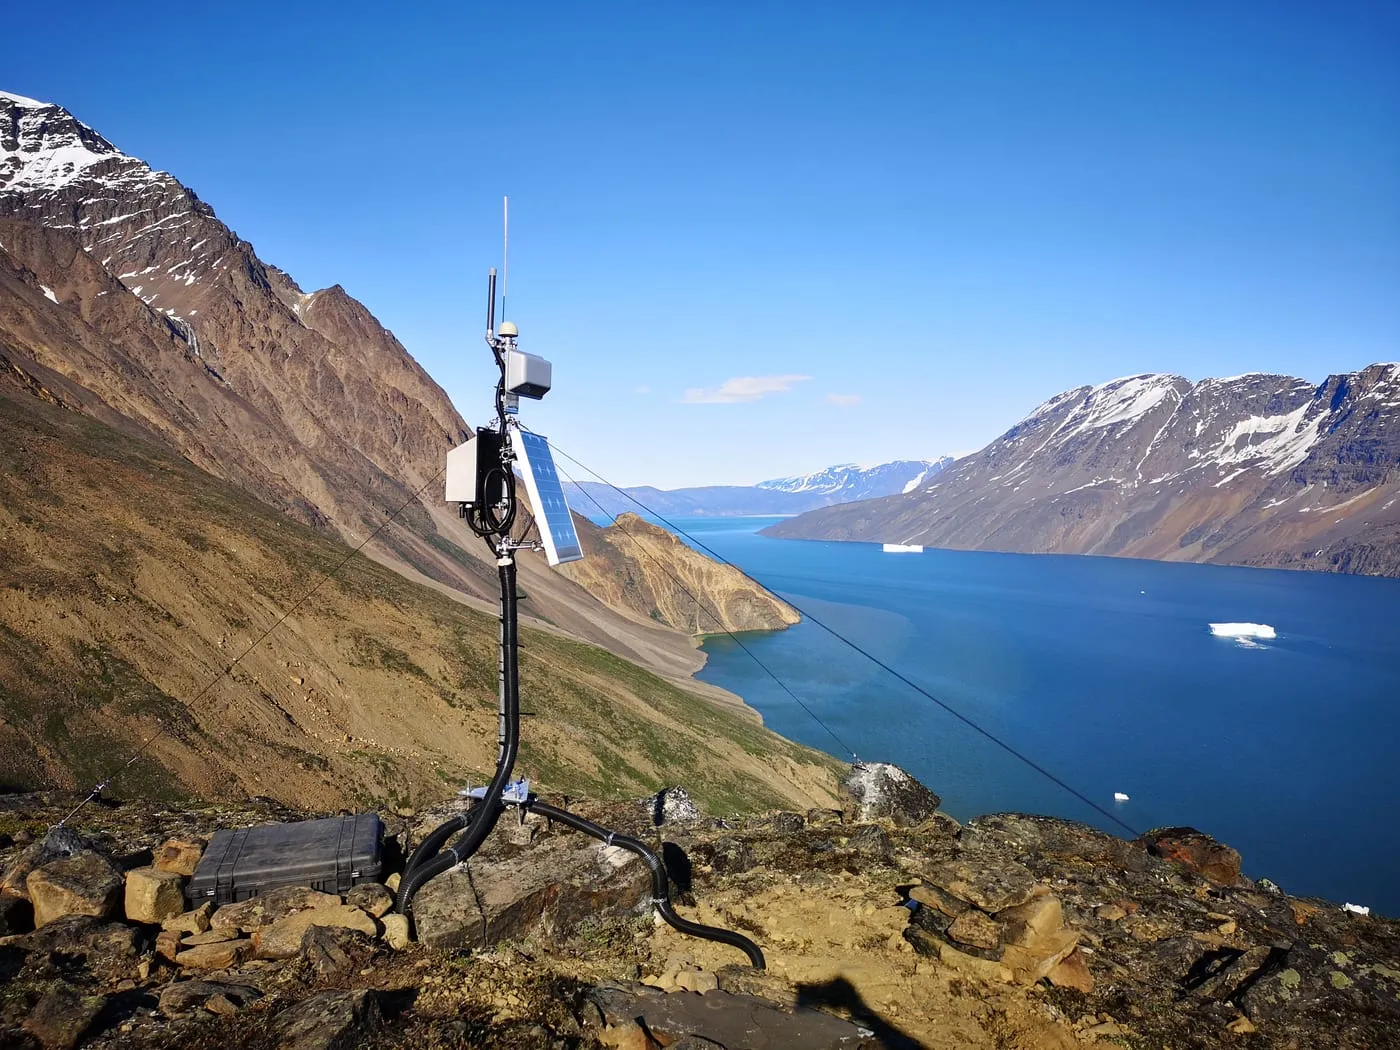
A solar-powered Seismicstream mast with radio and GNSS antennas above a fjord

Seismolytics

Detection algorithms and analysis

Seismolytics is where the detectors are developed. Algorithms are prototyped and validated against annotated events recorded in the field, then ported to run in the pod's firmware — so what we test offline is what runs on the device. The same tooling powers the analysis backend, where detections are reviewed by experts and fed back into the next round of tuning.

  • Detectors tuned to the site
  • Validated against annotated debris flows and floods
  • Same algorithm available for on-device detection and post-analysis
  • Expert-in-the-loop verification of detections
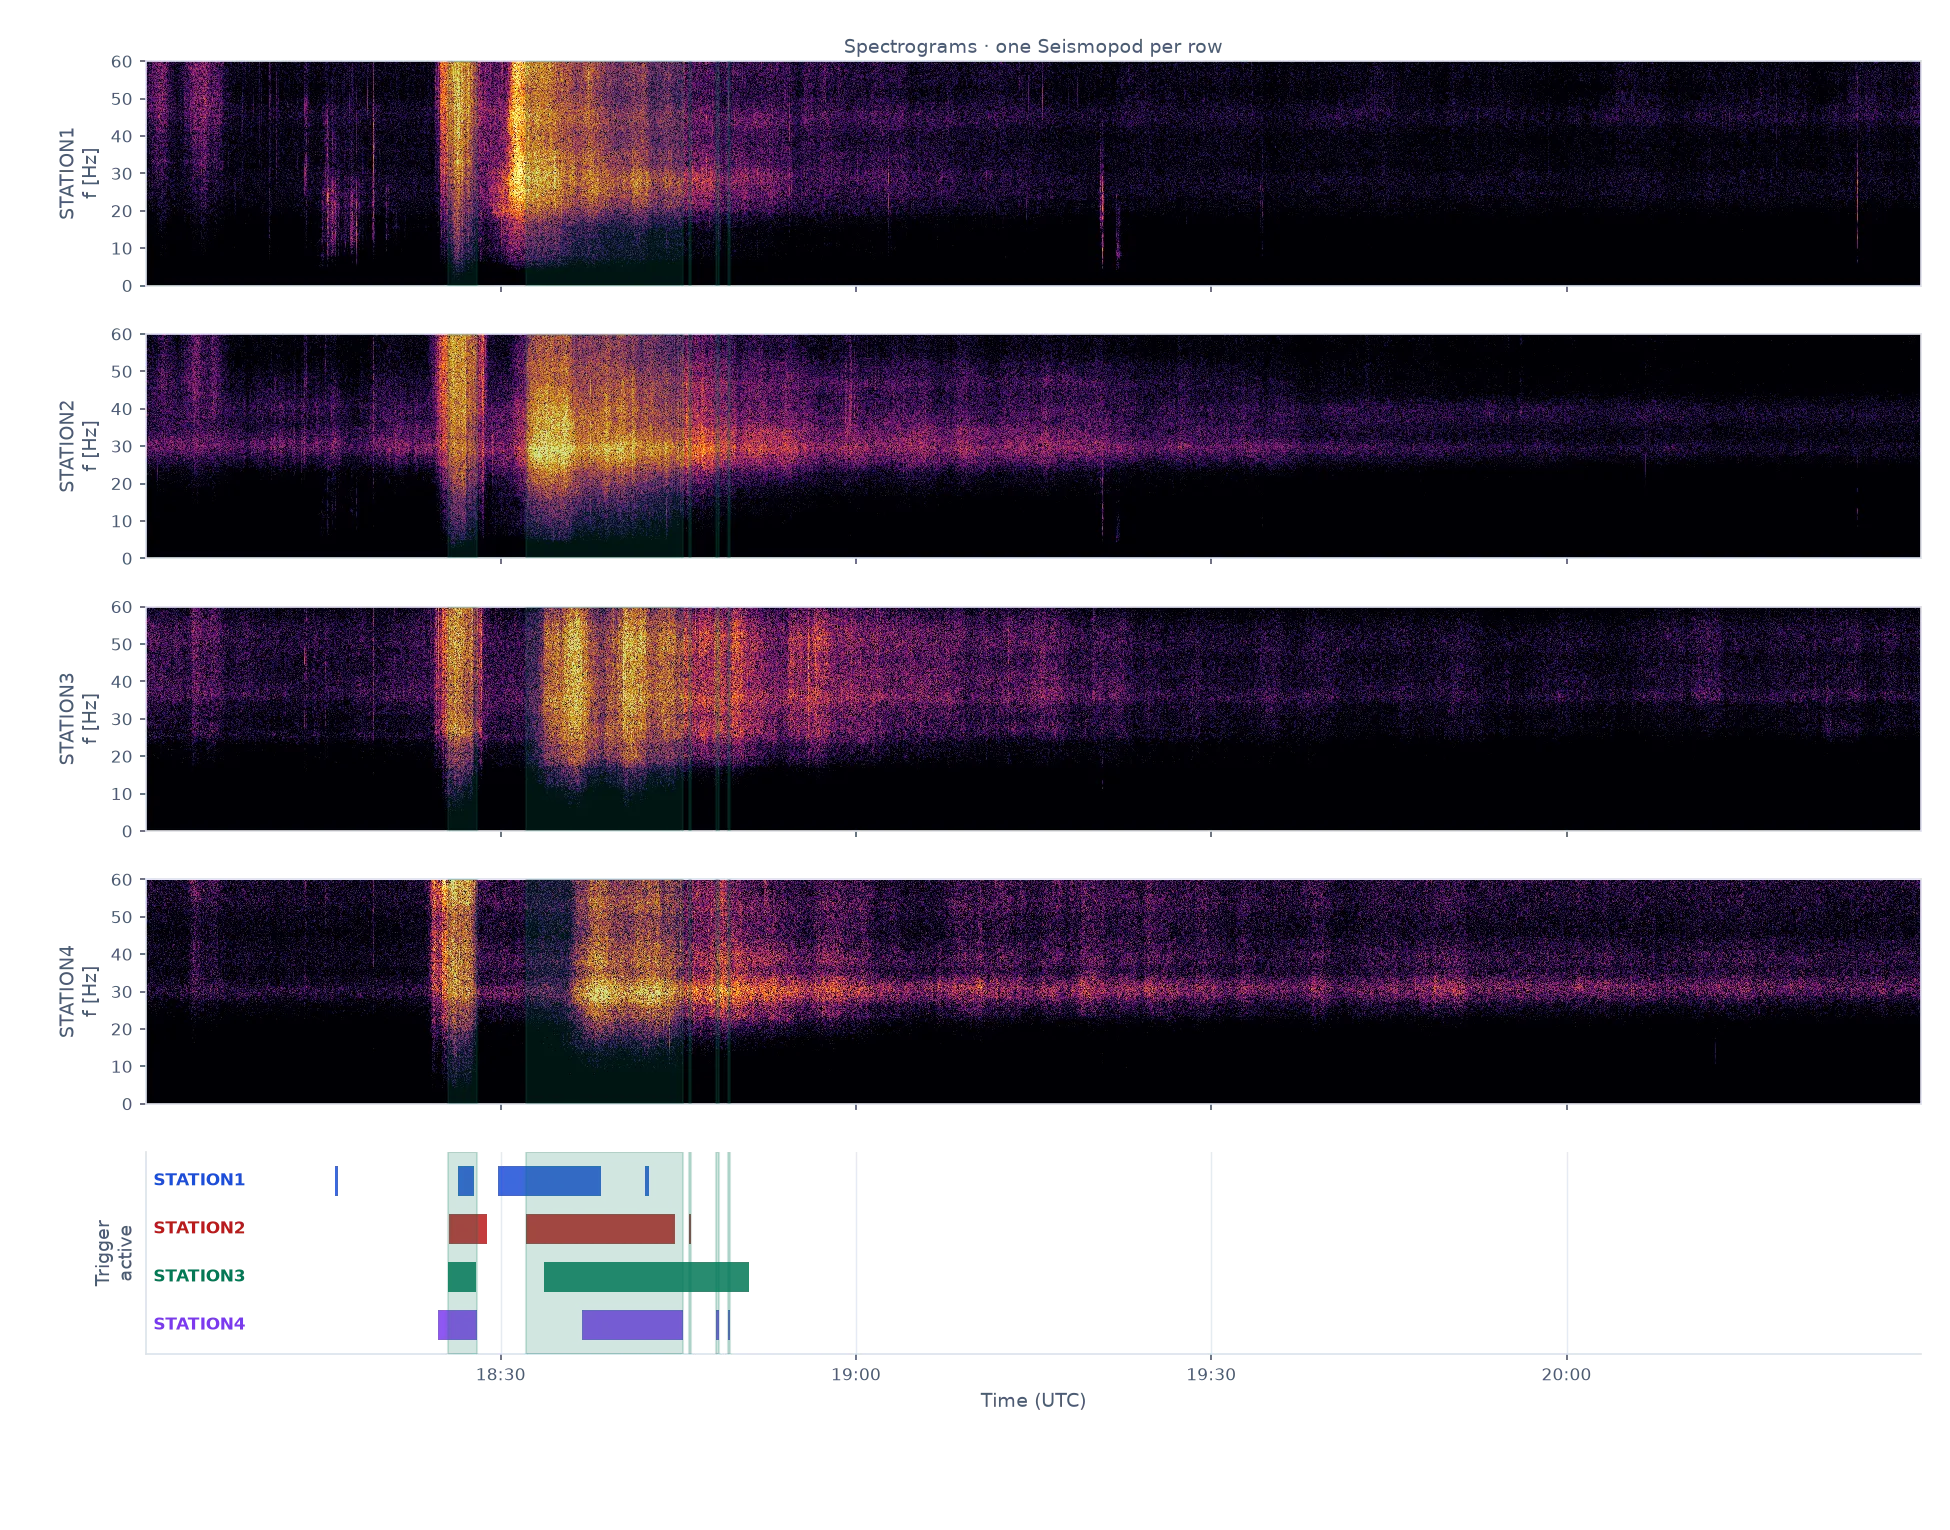
Detector response at an Alpine debris-flow site: ground motion and the trigger state the pod derives from it

A detection, end to end

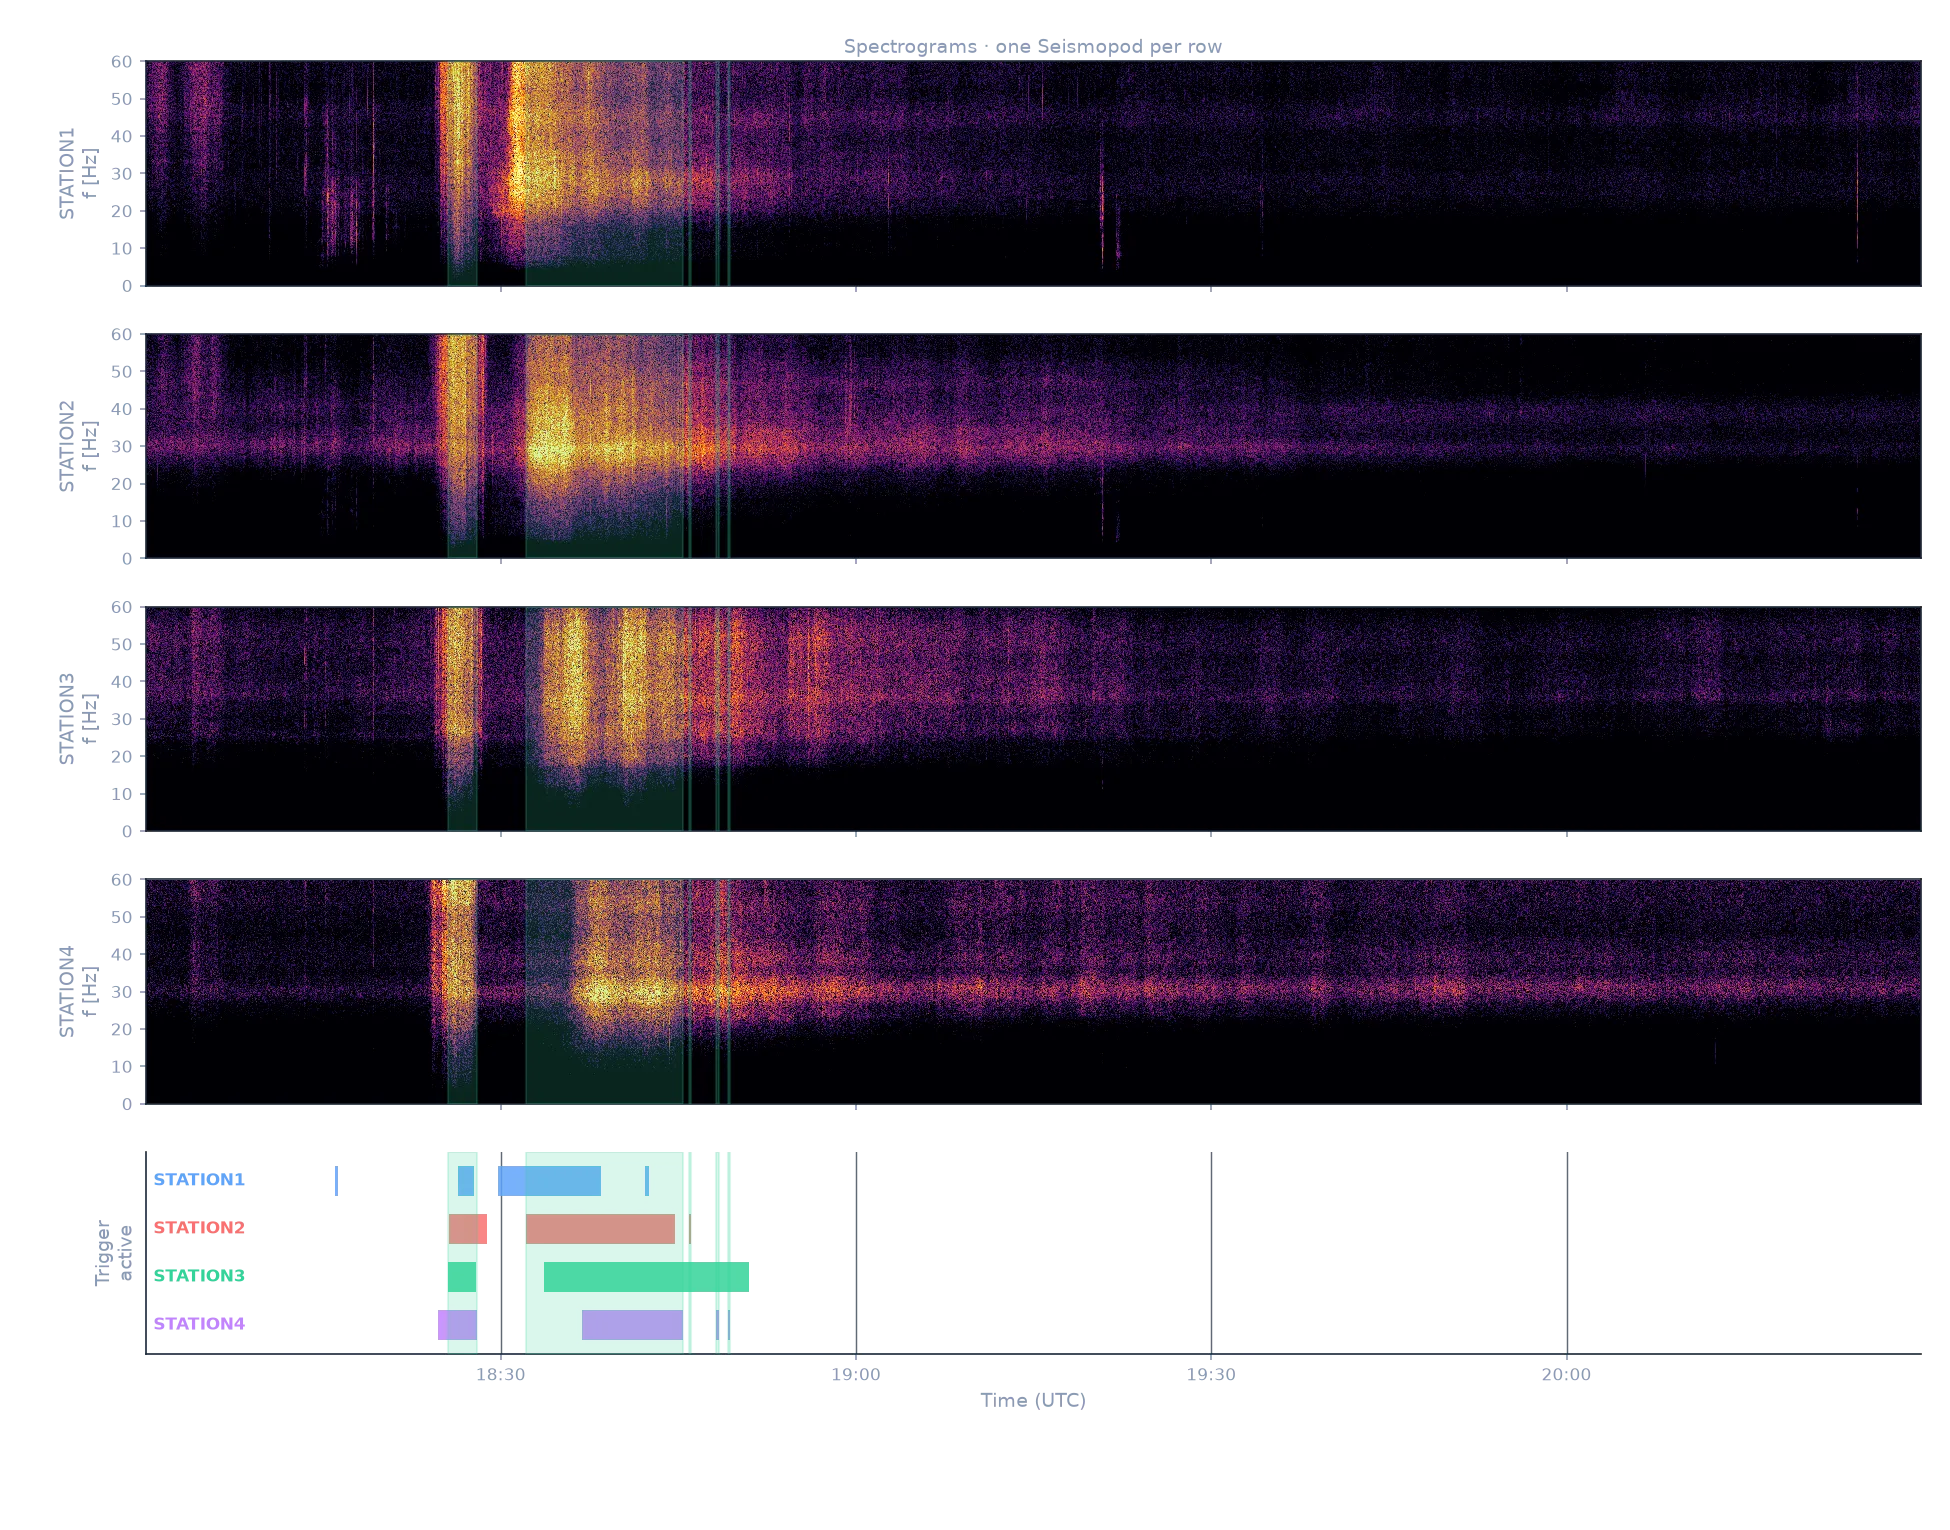
This is a real episode at an Alpine debris-flow site, recorded in June 2025 by four Seismopods of one deployment. Each row is one pod's spectrogram; below them, the trigger state each pod computes on-device from the recorded ground motion.

Between 18:25 and 18:51 UTC the ground motion rises orders of magnitude above the background and every pod in the deployment triggers. Based on those triggers, the Seismobase decides to raise the alarm. For the rest of the window no activity is present and the network stays silent. Strong outlier signals are ignored and no alarm is raised.

An Alpine debris-flow site, June 2025 — four Seismopods of one deployment, STATION1 to STATION4: spectrograms and the per-station trigger state. Shading marks the spans where our algorithm detects relevant activity and triggers a warning.

Monitoring and data

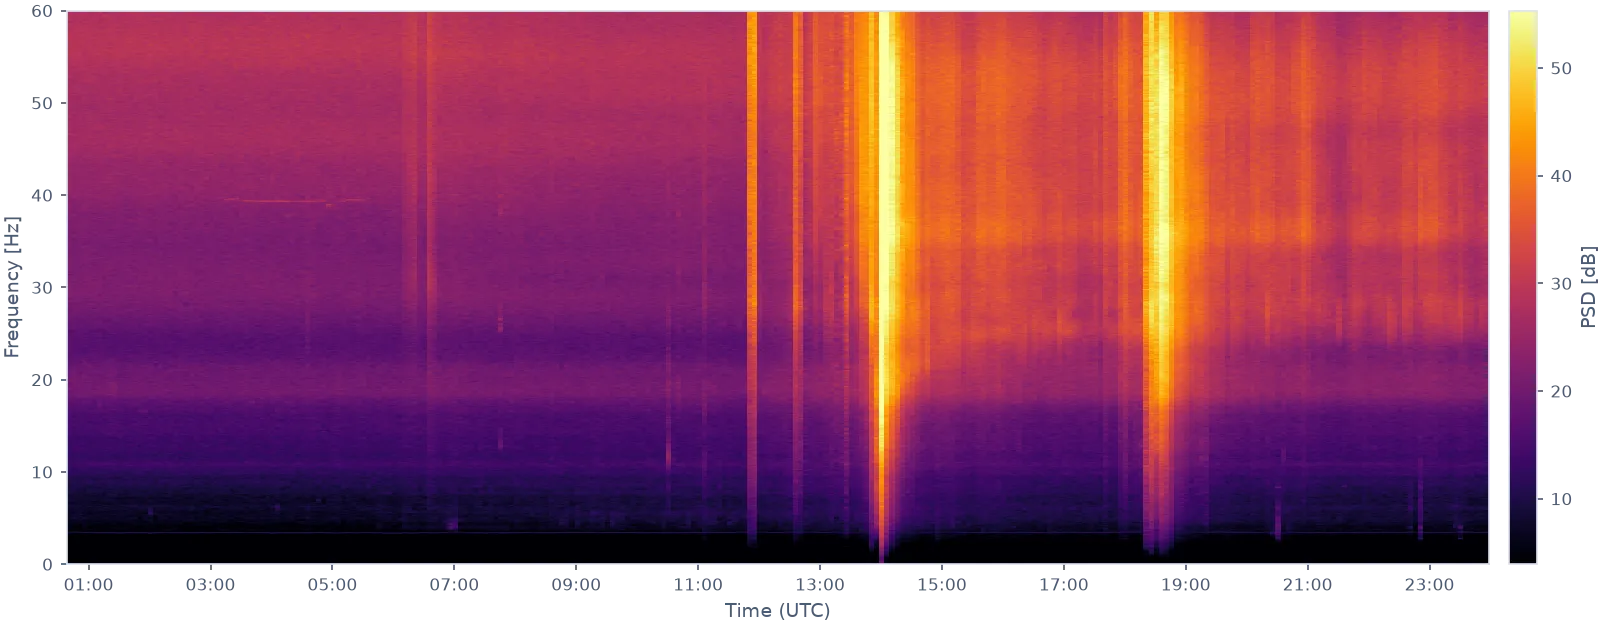
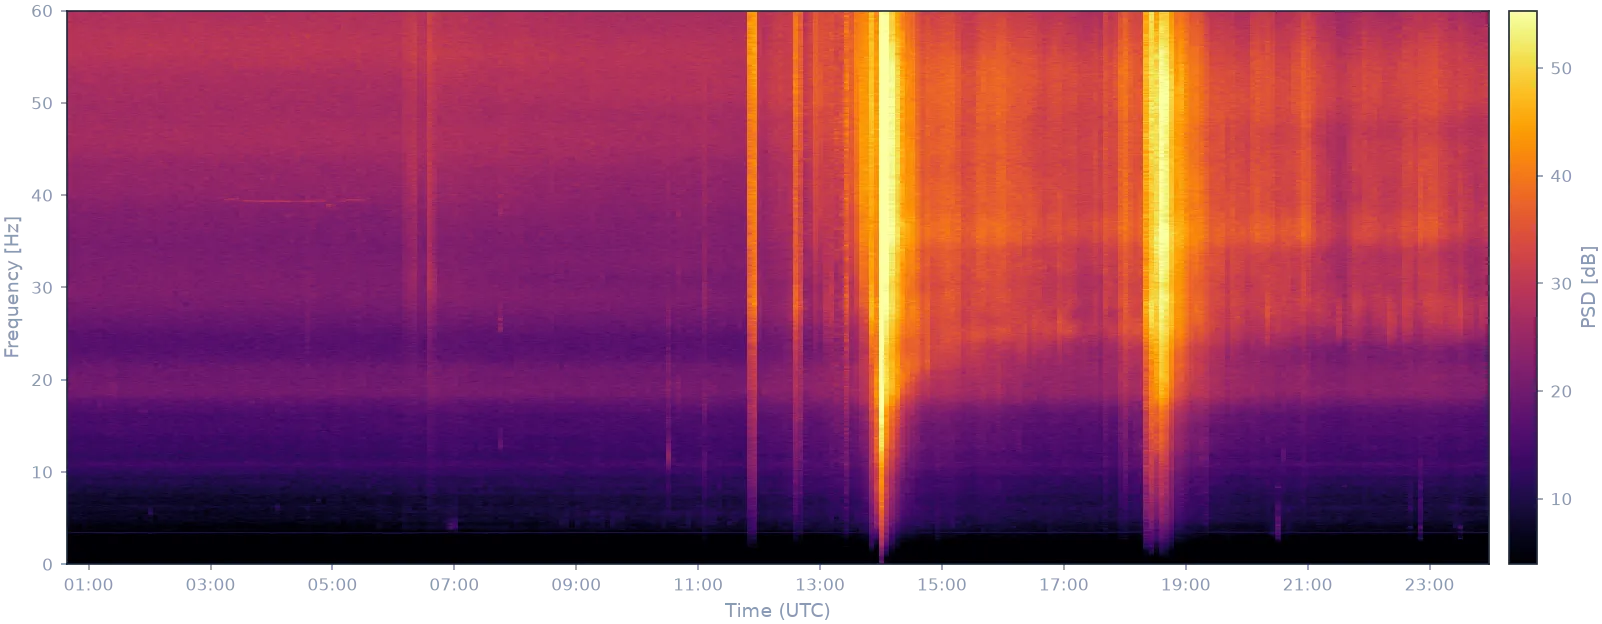
Our backend keeps the full picture of a deployment: which pods are reporting, how they are powered, what they have detected, and how the ground has been behaving over time. Spectrograms and waveforms remain available for every station, so an event can be reviewed and verified after the fact. Spectrograms are transmitted from the Seismopods continuously; waveforms can be retrieved on demand. Both views below come from the same deployment, on the same day as the episode above.

A full day of aggregated power spectral density for STATION3 of that deployment. A long-term view used to spot changing ground conditions. The episode of the previous figure is the bright column just before 19:00 UTC.
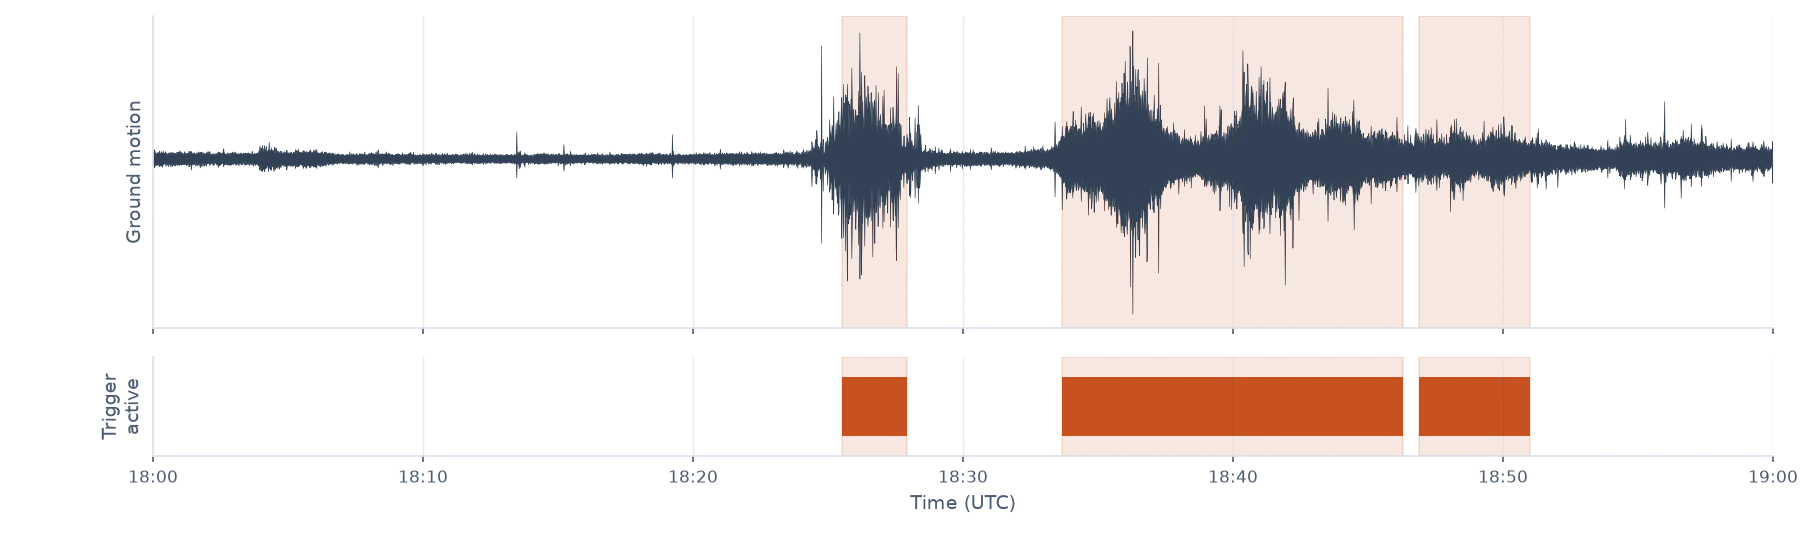
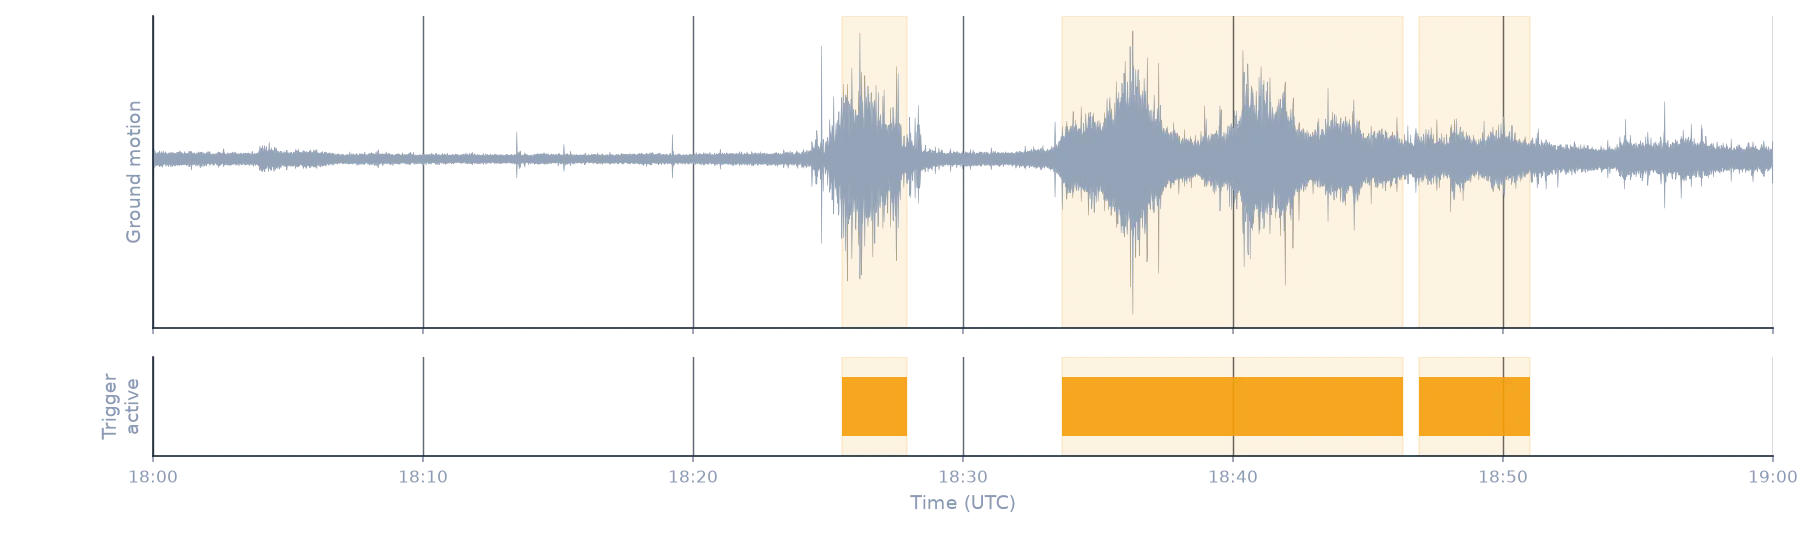
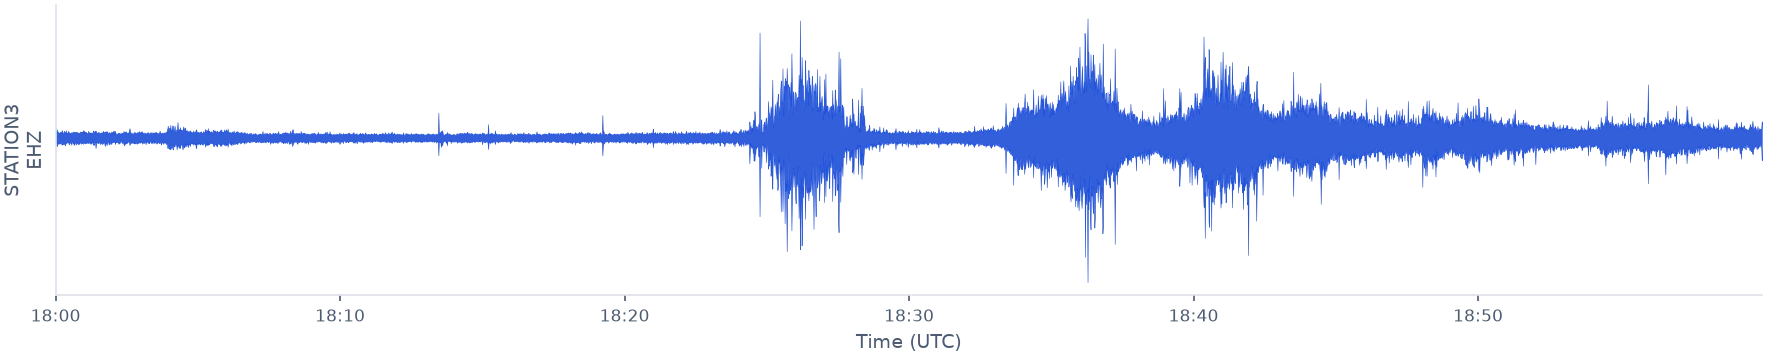
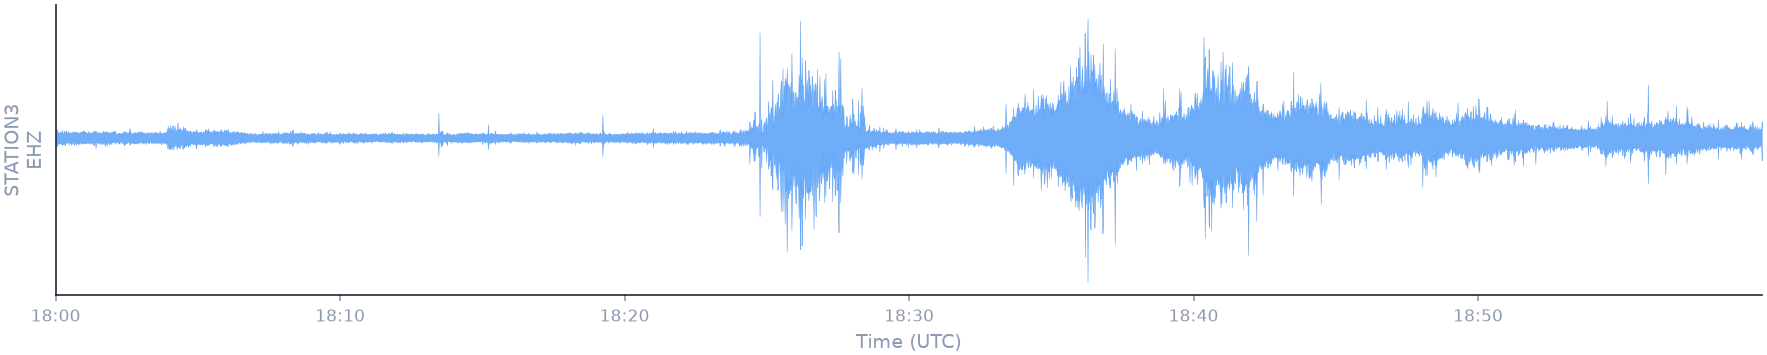
Raw ground motion from the same Seismopod during that episode, which can be used for post-event review.

Want this for your terrain?

Tell us about the use case and we will discuss a custom solution for your terrain.

Get in touch